Customer Retention Rate: Benchmarks & Strategies for Shopify
Acquiring a new customer costs 5x more than keeping an existing one. Here's how to calculate your retention rate, where you stand against benchmarks, and strategies that actually work.
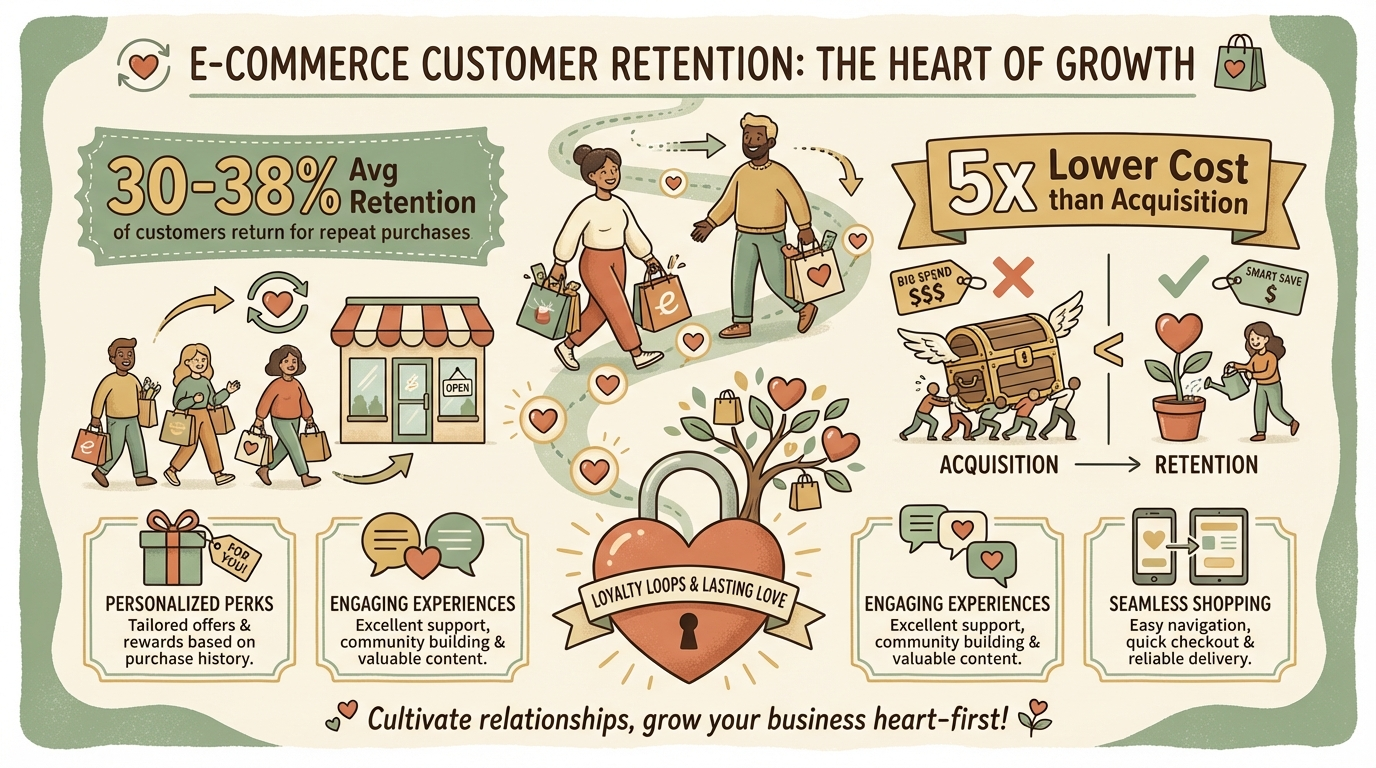
Most e-commerce stores obsess over acquiring new customers. But the math clearly shows that retention is where the real money is made—returning customers spend 67% more than new ones and cost 5x less to convert[1].
For Shopify stores, repeat customers account for up to 60% of total sales. Understanding and improving your retention rate isn't optional—it's essential for sustainable growth.
30-38%
Avg Retention
E-commerce industry average
67%
Higher Spend
Repeat customers vs new
5x
Lower Cost
Retention vs acquisition
What is Customer Retention Rate?
Customer Retention Rate (CRR) measures what percentage of customers continue to buy from you over a specific time period. It's the opposite of churn rate—if your retention is 35%, your churn is 65%.
A high retention rate indicates customers are satisfied, see ongoing value in your products, and have developed loyalty to your brand. A low rate signals problems with product quality, customer experience, or competitive positioning.
Retention vs Repeat Purchase Rate
Retention Rate: % of customers who make any purchase in a period after their first.
Repeat Purchase Rate: % of customers who have made 2+ purchases total.
Both matter, but retention tracks ongoing behavior over time.
Retention Benchmarks by Industry
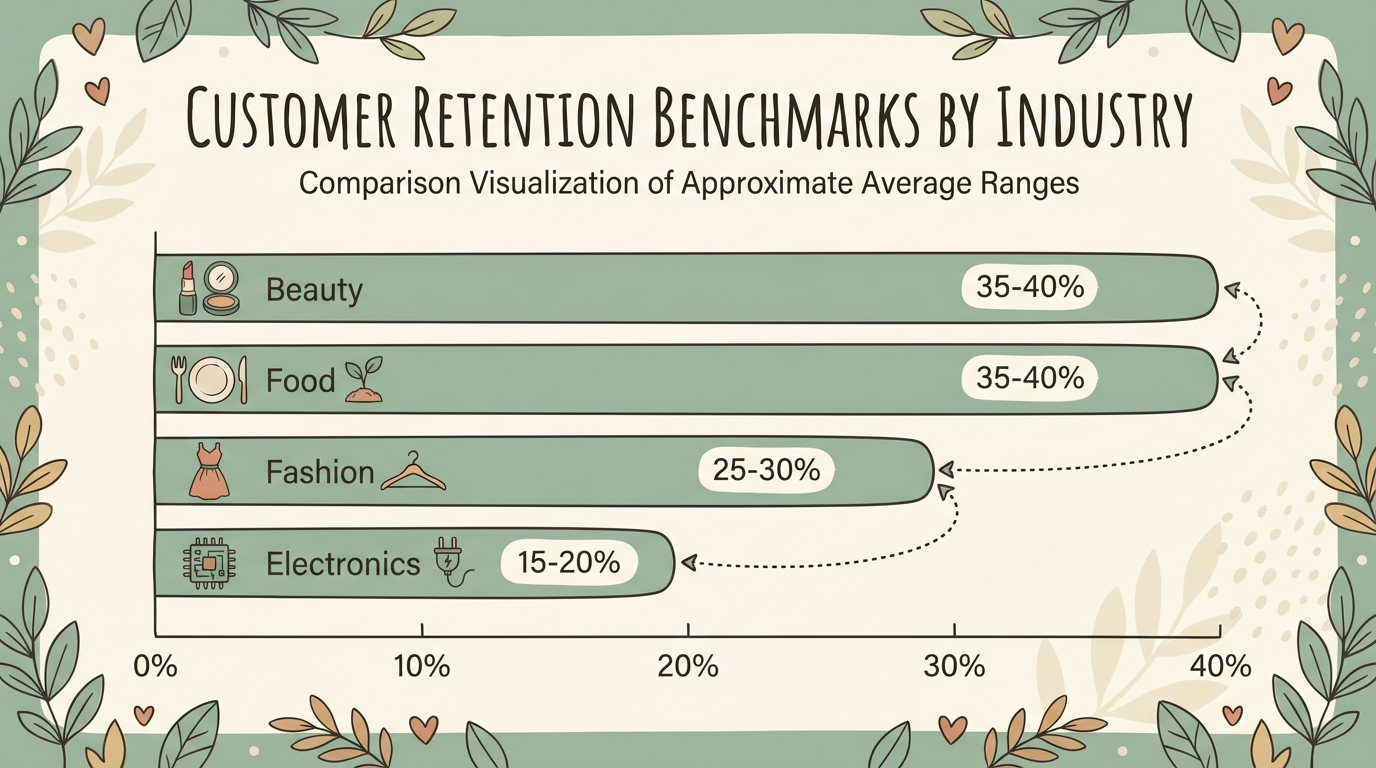
E-commerce retention rates vary widely by industry. Here's where different sectors typically land:
| Industry | Avg Retention | Top Performers |
|---|---|---|
| Overall E-commerce | 30-38% | 50%+ |
| Subscription Boxes | 40-45% | 60%+ |
| Beauty & Skincare | 35-40% | 55%+ |
| Food & Beverage | 35-40% | 55%+ |
| Fashion & Apparel | 25-30% | 45%+ |
| Electronics | 15-20% | 35%+ |
| Home & Furniture | 10-15% | 25%+ |
Consumable products (beauty, food, supplements) naturally have higher retention because customers need to repurchase. Durable goods (furniture, electronics) have lower rates due to longer purchase cycles[2].
What's Good for Your Store?
If you're below industry average, focus on retention improvement. If you're at or above average, you're doing well—but there's always room to optimize. Top 10% performers typically achieve 1.5-2x the industry average.
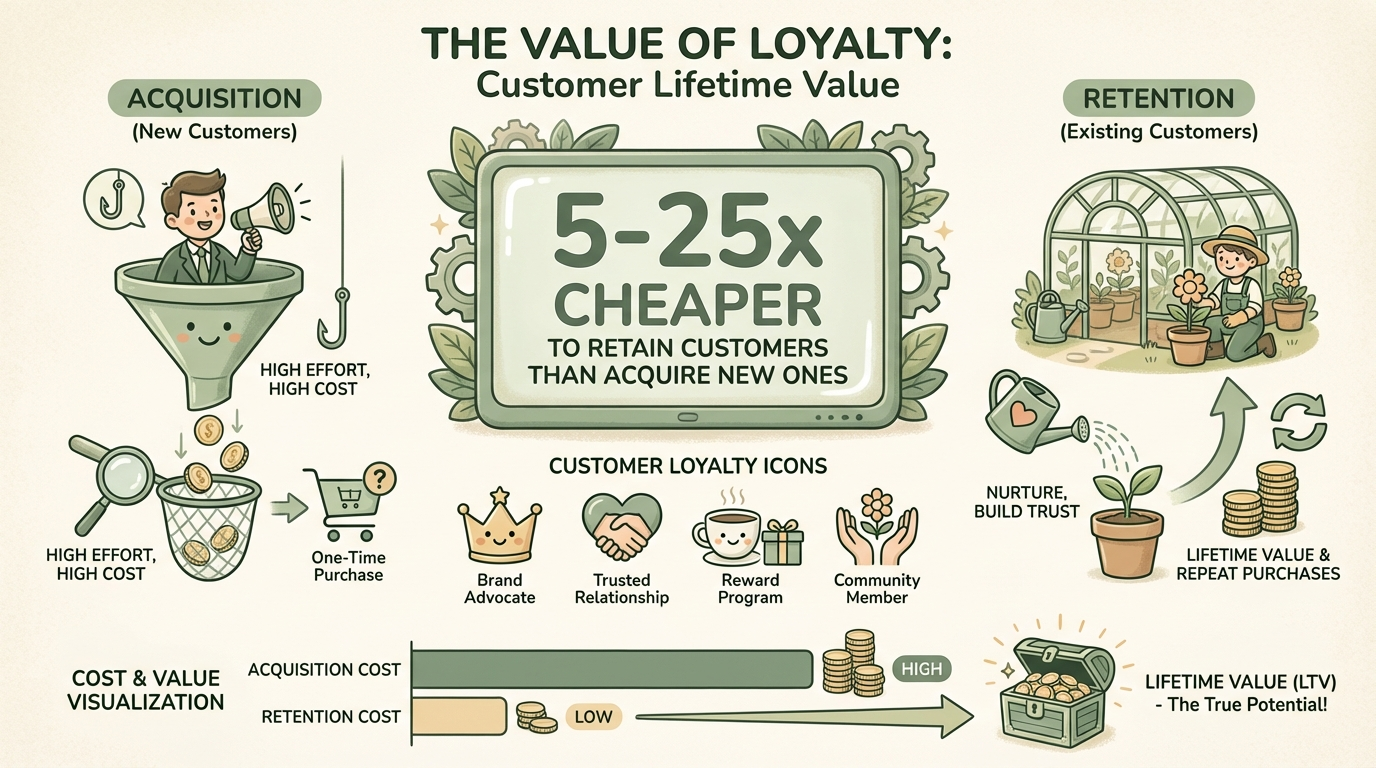
Why Retention Matters More Than Acquisition
The economics of retention vs acquisition are stark:
| Metric | New Customers | Returning Customers |
|---|---|---|
| Conversion probability | 5-20% | 60-70% |
| Average order value | Baseline | +67% higher |
| Cost to acquire | $50-100+ | ~$10-20 (retention marketing) |
| Referral likelihood | Low | High (86% refer friends) |
| New product adoption | Low | 50% more likely |
25-95%
Revenue Increase
From 5% retention improvement
60%
DTC Sales
Come from repeat customers
2.5x
Faster Growth
For retention-focused brands
A 5% increase in retention can boost profits by 25-95%[3]. This is because repeat customers have already been acquired (no CAC), convert at higher rates, and spend more per order.
This is also why Customer Lifetime Value (CLV) is such an important metric—it captures the full value of retained customers.
How to Calculate Your Retention Rate
The Basic Formula
Retention Rate = ((E - N) / S) × 100
E = Customers at end of period | N = New customers acquired | S = Customers at start
Example Calculation
Let's say at the start of Q1 you had 1,000 customers. During Q1:
- You acquired 300 new customers
- You ended Q1 with 950 customers
Retention Rate = ((950 - 300) / 1,000) × 100 = 65%
This means 65% of your original customers made a repeat purchase during the quarter.
Cohort-Based Retention
For deeper insights, track retention by customer cohort (when they first purchased). This shows how retention changes over time and helps identify if recent customers are more or less loyal than older ones.
| Cohort | Month 1 | Month 3 | Month 6 | Month 12 |
|---|---|---|---|---|
| Jan 2025 | 100% | 45% | 30% | 20% |
| Apr 2025 | 100% | 50% | 35% | — |
| Jul 2025 | 100% | 55% | — | — |
In this example, July cohort shows better early retention, suggesting recent improvements are working.
Top Retention Strategies
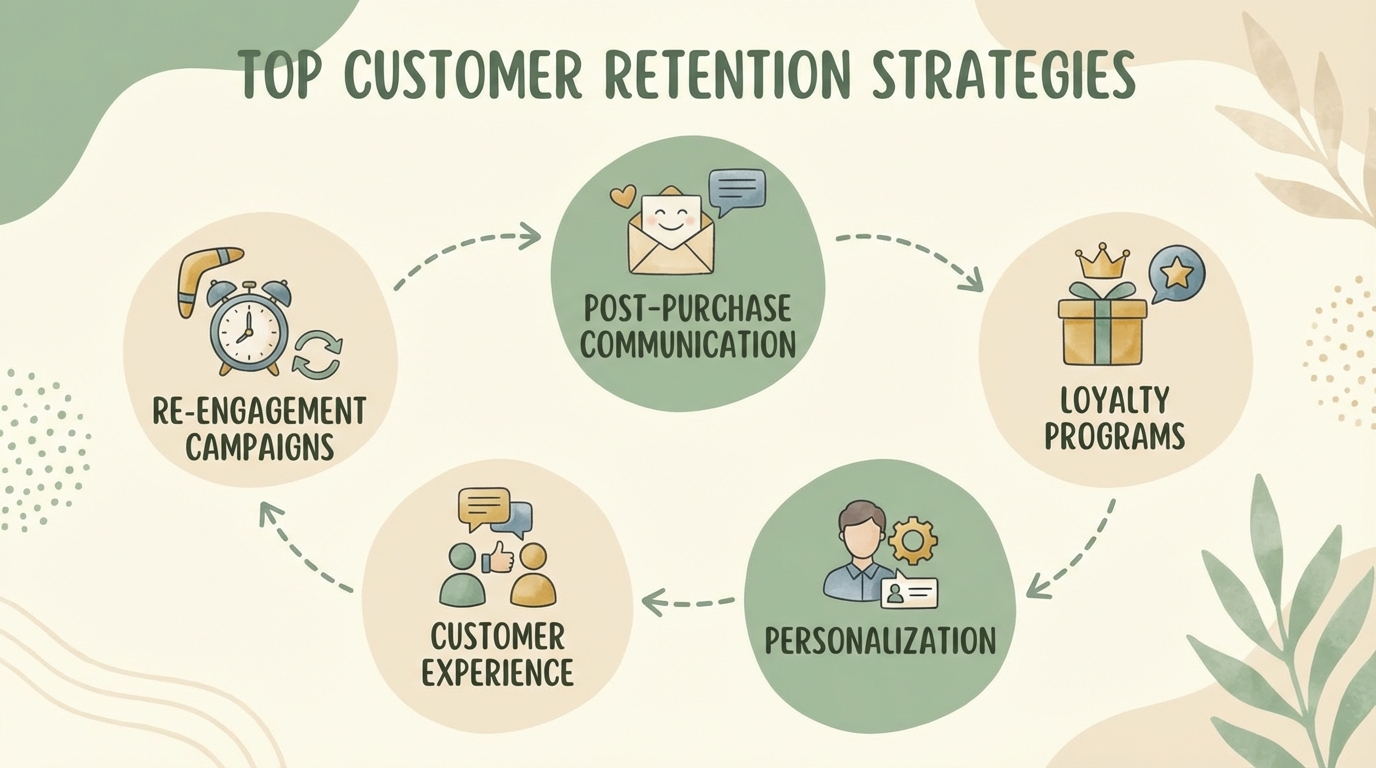
1. Post-Purchase Communication
The period right after purchase is critical. Customers who feel connected to your brand after buying are much more likely to return.
Order confirmation + tracking
Keep customers informed and excited about their purchase
Delivery follow-up
Check in after delivery, ask for feedback, offer support
Product education
Tips for using their purchase, care instructions, recipes, etc.
Replenishment reminders
Timed messages when consumable products are running low
SMS outperforms email for post-purchase communication with 98% open rates vs 20% for email.
2. Loyalty Programs
Loyalty programs give customers a reason to return beyond just product need. 82% of high-performing retention programs use personalized rewards[4].
Points-based rewards
Earn points on purchases, redeem for discounts or products
Tiered programs
Better perks for higher-spending customers (VIP status)
Store credit
Cash-back in store credit drives repeat purchases
Referral bonuses
Reward customers for bringing in new customers
3. Personalization
Personalization can boost retention by 10%+ when done well. Customers expect recommendations based on their purchase history, not generic broadcasts.
Product recommendations
AI-powered suggestions based on purchase history
Personalized email/SMS
Segment communications by behavior and preferences
Dynamic website content
Show returning visitors personalized homepage and recommendations
Learn how Upsella uses AI to personalize post-purchase product recommendations automatically.
4. Customer Experience Excellence
89% of companies prioritize customer experience—and for good reason. One bad experience can lose 17% of customers permanently[5].
Fast, helpful support
Quick response times and resolution matter more than perfection
Easy returns
Hassle-free return policies increase purchase confidence
Proactive communication
Notify customers of issues before they discover them
5. Strategic Re-engagement
Not all customers will naturally come back. Re-engagement campaigns target lapsed customers before they're gone forever.
Win-back campaigns
Target customers who haven't purchased in 60-90 days
Browse abandonment
Remind customers who viewed but didn't buy
Replenishment reminders
Automated reminders when consumables run low
The 3+ Purchase Threshold
Customers who make 3+ purchases are 3x more likely to become long-term loyal customers. Focus extra attention on converting one-time buyers into second-time buyers, and second-time into third-time.
Measuring Retention Success
Track these metrics alongside retention rate to get the full picture:
| Metric | What It Measures | Good Benchmark |
|---|---|---|
| Retention Rate | % of customers who return | 35%+ for e-commerce |
| Repeat Purchase Rate | % with 2+ lifetime orders | 25-30%+ |
| Purchase Frequency | Orders per customer per year | Varies by product type |
| Customer Lifetime Value | Total revenue from customer | 3x+ CAC |
| Net Promoter Score (NPS) | Customer satisfaction/loyalty | 50+ is excellent |
| Churn Rate | % of customers lost | Lower is better |
For a deeper dive on CLV, see our complete CLV guide.
Conclusion
Customer retention is the foundation of sustainable e-commerce growth. With retention costing 5x less than acquisition and generating significantly higher revenue per customer, improving your retention rate should be a top priority.
Start by calculating your current retention rate and comparing to industry benchmarks. Then implement strategies that match your product type—post-purchase communication for all stores, loyalty programs for repeat-purchase products, and personalization everywhere possible.
The most effective retention happens in the moments after purchase, when customers are most engaged with your brand. Upsella's AI-powered SMS automates this critical window, keeping customers connected and driving repeat purchases automatically.
References
- VennApps. "E-commerce Customer Retention Statistics". 2024.
- First Page Sage. "Customer Retention Rates by Industry". 2024.
- Sprinklr. "Customer Retention Statistics". 2024.
- Rivo. "Customer Retention Statistics for E-commerce". 2024.
- Mailmodo. "Customer Retention Statistics Guide". 2024.
Ready to boost your revenue with SMS upsells?
Upsella automatically sends AI-powered SMS upsells after customer purchases. Start your free trial today and unlock hidden revenue effortlessly.
Related Articles
How to Calculate Customer Lifetime Value (CLV) for Shopify
CLV tells you how much revenue a customer generates over their entire relationship with your store. Here
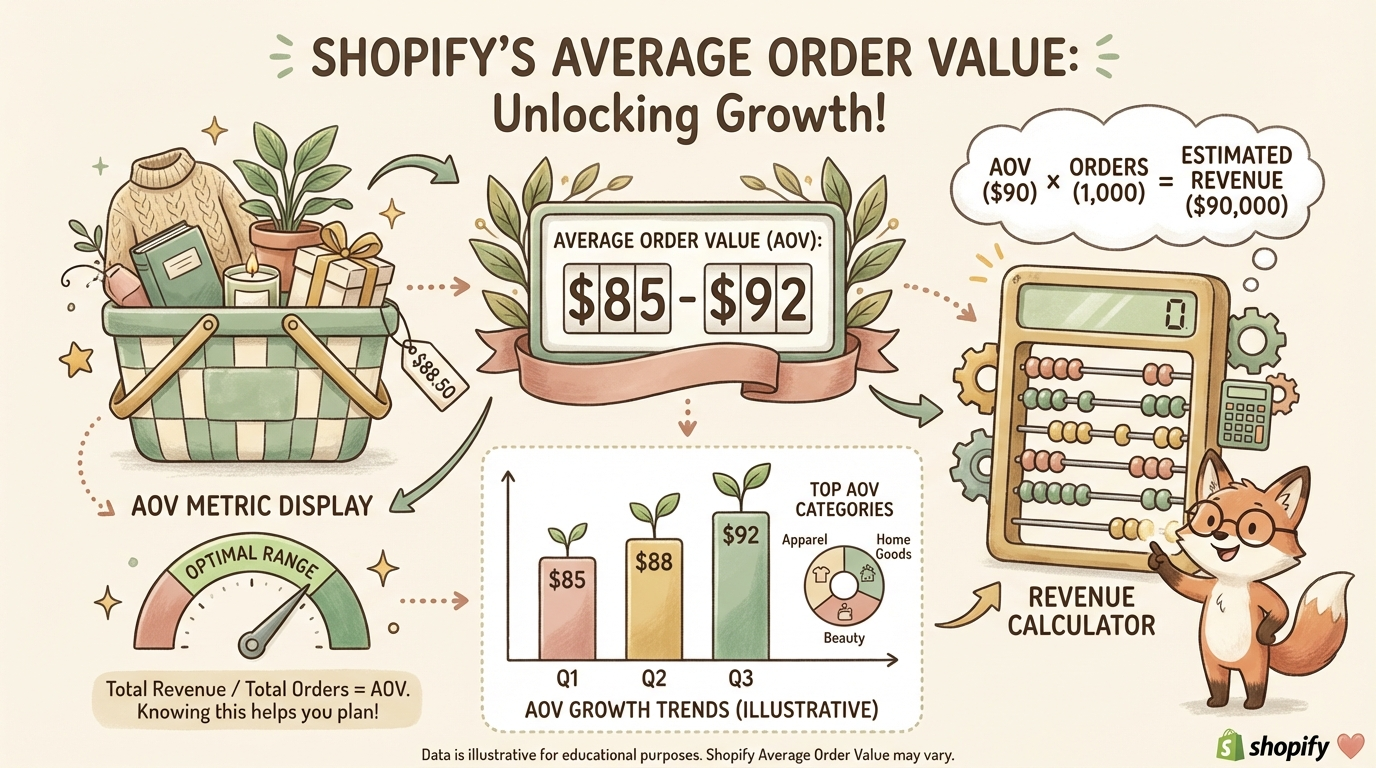
How to Increase Average Order Value on Shopify: 12 Proven Strategies
Increasing AOV is often easier and more profitable than acquiring new customers. Here are 12 battle-tested strategies with real benchmarks and impleme...
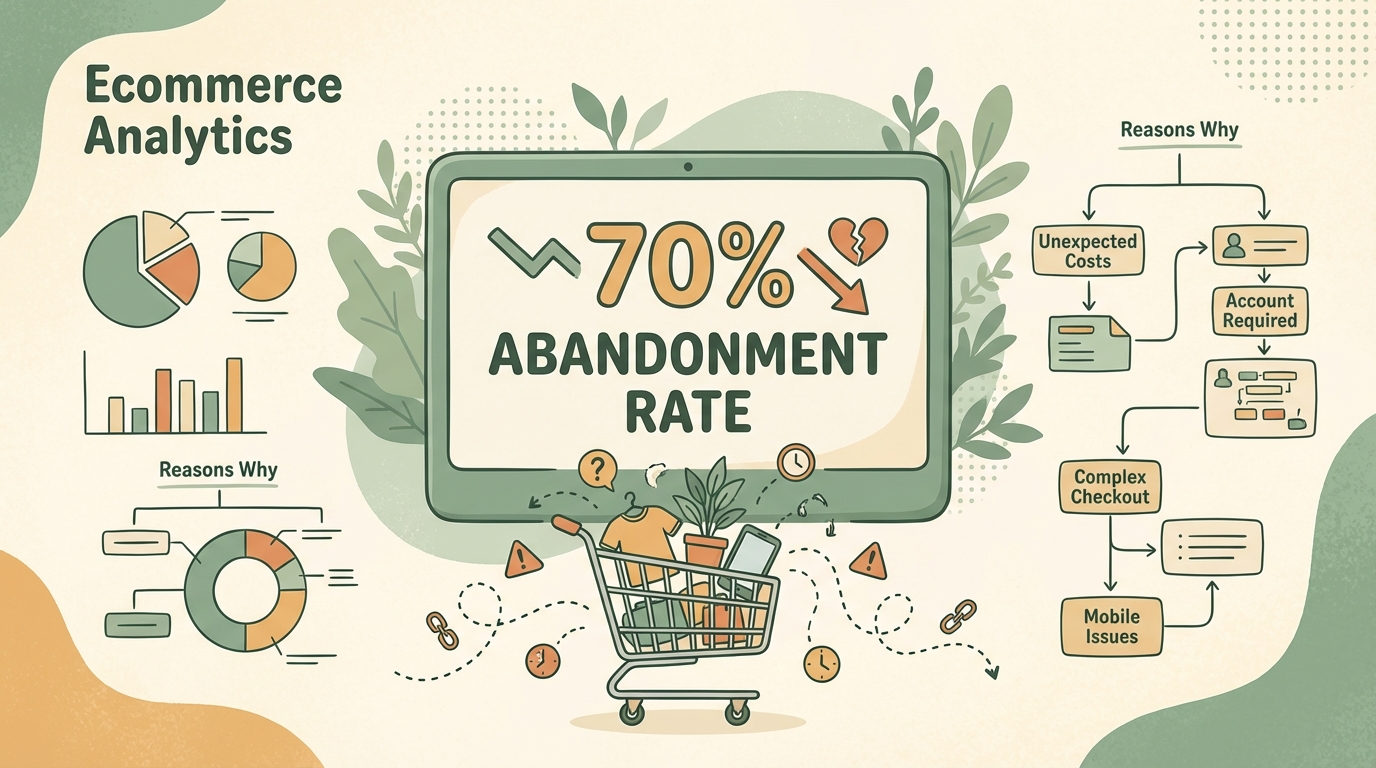
Cart Abandonment Statistics 2025: What Every Shopify Store Should Know
Nearly 7 out of 10 shopping carts are abandoned before checkout. Here