Cart Abandonment Statistics 2025: What Every Shopify Store Should Know
Nearly 7 out of 10 shopping carts are abandoned before checkout. Here's what the latest data tells us about why—and how to recover that lost revenue.
The Cart Abandonment Problem
Cart abandonment is one of the biggest challenges in ecommerce. Customers browse your store, add items to their cart, and then... leave without buying. It happens to every store, but the scale of the problem might surprise you.
The good news? Understanding the data helps you identify opportunities to recover significant revenue. Here are the latest cart abandonment statistics for 2025.
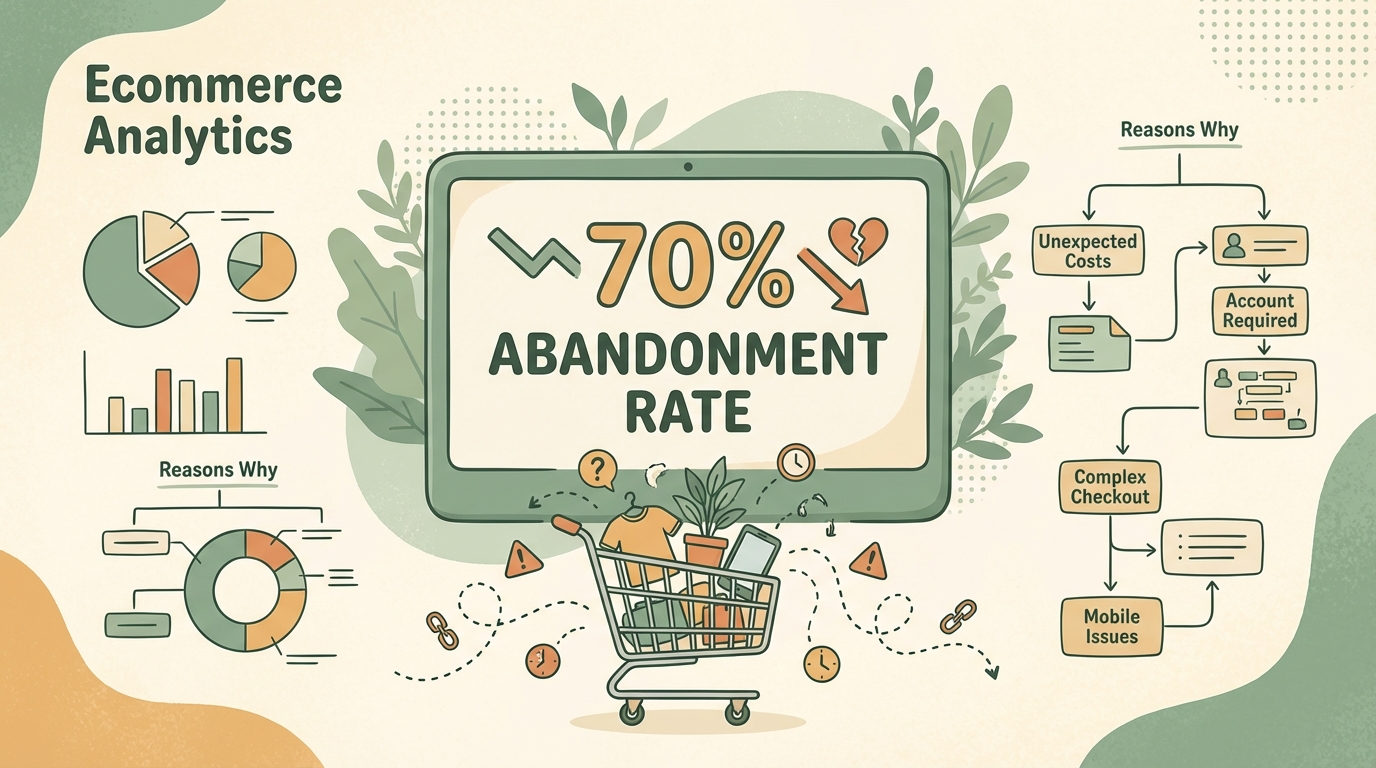
70-78%
Average Abandonment Rate
7 out of 10 carts abandoned
$18B
Annual Lost Revenue
Revenue lost to abandonment yearly
85%
Mobile Abandonment
Highest device abandonment rate
48%
Due to Extra Costs
Top reason for abandonment
Overall Cart Abandonment Rate (2025)
The global average cart abandonment rate in 2025 ranges from 70% to 78%, depending on the study and methodology[1][2]:
- Baymard Institute: 70.22% (average of 50 studies)
- Email Vendor Selection: 74.8% (comprehensive analysis)
- August 2025 data: 78.77% (most recent global figure)
What This Means
“Cart abandonment isn't a bug in ecommerce—it's a feature. Customers use carts to browse, compare, and save items. The key is bringing them back.”
Cart Abandonment Rates by Industry
Abandonment rates vary significantly across industries[3][4]:
| Industry | Abandonment Rate | Key Factor |
|---|---|---|
| Travel & Hospitality | 87.1% | Complex booking, comparison shopping |
| Fashion & Apparel | 84.6% | Size/fit concerns, high return rates |
| Luxury & Jewelry | 82.8% | High price points, deliberation |
| Beauty & Personal Care | 80.9% | Product discovery, sampling needs |
| Home & Furniture | 80.3% | Big-ticket purchases, room planning |
| Automotive | 75.4% | Complex purchases, in-person preference |
| Electronics | 71.8% | Price comparison, spec research |
| General Retail | 72.2% | Varies by product mix |
| Grocery & Essentials | 50-62% | Necessity purchases, less comparison |
| Pet Care | 56.1% | Recurring purchases, brand loyalty |
Industry Context
Cart Abandonment by Device
Device type significantly impacts abandonment rates[1][3]:
85.2%
Mobile
Highest abandonment rate
70.3%
Tablet
Mid-range abandonment
66.7%
Desktop
Lowest abandonment rate
Mobile has the highest abandonment rate—15-20 percentage points higher than desktop. This matters because mobile traffic now represents the majority of ecommerce visits.
Why Mobile Abandonment is Higher
Smaller Screens
Checkout forms are harder to complete on small displays
Slower Typing
Entering payment and shipping details takes longer
Distracted Browsing
Mobile users are often multitasking or browsing casually
Poor Mobile UX
Many sites still have suboptimal mobile checkout experiences
Mobile Optimization Priority
Top Reasons Customers Abandon Carts
Understanding why customers leave is the first step to bringing them back[1][4]:
| Reason | % of Abandonments | Solution |
|---|---|---|
| Unexpected costs (shipping, tax, fees) | 48-49% | Show total costs early; free shipping thresholds |
| Required account creation | 24-26% | Offer guest checkout option |
| Slow/long delivery | 21% | Offer express shipping; show delivery dates |
| Don't trust with credit card | 19% | Add trust badges, SSL, reviews |
| Complicated checkout process | 18% | Reduce steps; simplify forms |
| Couldn't calculate total cost | 17% | Show running total; upfront tax calculation |
| Limited payment options | 13% | Add PayPal, Apple Pay, Buy Now Pay Later |
| Website errors/crashed | 12% | Regular testing; performance optimization |
| Unsatisfactory return policy | 11% | Clear, generous return policy |
The Shipping Trap
Revenue Lost to Cart Abandonment
The financial impact of cart abandonment is staggering[4][5]:
$18B
Annual US Loss
Revenue lost to abandonment yearly
$4T
Global Loss
Worldwide abandoned cart value
What This Means for Your Store
Let's put this in perspective for a typical Shopify store:
Example Calculation:
- Monthly visitors: 10,000
- Add-to-cart rate: 10% (1,000 carts)
- Cart abandonment: 70% (700 abandoned)
- Average cart value: $75
- Lost revenue: $52,500/month
Even recovering 10% of abandoned carts would add $5,250/month to this store's revenue. At 15% recovery (achievable with SMS), that's nearly $8,000/month.
Calculate Your Opportunity
Cart Recovery Methods & Success Rates
Not all recovery methods are created equal[4]:
Email Recovery
| Metric | Performance |
|---|---|
| Open rate | 41.8% |
| Conversion rate | 10.7% |
| Brands using it | 68% of DTC brands |
SMS Recovery
| Metric | Performance |
|---|---|
| Open rate | 98% |
| Conversion rate | 10-15% |
| Revenue per message | $3.46-$10.78 |
Other Effective Strategies
Trust Badges & Security Indicators
Can reduce abandonment by up to 28%
Guest Checkout
Prevents 26% of abandonments from forced account creation
Exit-Intent Popups
Capture 10-15% of leaving visitors with offers
Multiple Payment Options
Reduces 13% of abandonments from payment limitations
Clear Return Policies
Addresses 11% of abandonment concerns
SMS vs Email for Cart Recovery
Both channels have their place, but the data shows clear differences[6]:
| Metric | SMS | |
|---|---|---|
| Open rate | 98% | 41.8% |
| Response time | 90 seconds | 90 minutes |
| Recovery rate | 10-15% | 3-5% |
| Cost per message | $0.01-0.05 | $0.001-0.003 |
| Best timing | 1-2 hours after | 24 hours after |
The Winning Strategy
“SMS recovers 2-3x more abandoned carts than email alone. The immediacy and visibility of text messages make them impossible to ignore.”
Calculate Your Lost Revenue
Want to see exactly how much cart abandonment is costing your store—and how much you could recover?
Cart Abandonment Cost Calculator
Enter your store metrics to see your monthly lost revenue and recovery potential.
Calculate Your Lost Revenue →Conclusion
Cart abandonment is unavoidable, but it's also one of the biggest opportunities for revenue recovery. With 70-78% of carts abandoned globally—and mobile rates reaching 85%—even small improvements in recovery can significantly impact your bottom line.
Key takeaways from 2025 cart abandonment data:
- Average global abandonment: 70-78%
- Mobile abandonment: 85% (highest of all devices)
- Top reason: Unexpected costs (48-49%)
- SMS recovery rate: 10-15% (vs 3-5% for email)
- $18 billion lost annually to abandoned carts in the US alone
The stores winning at cart recovery are using a multi-channel approach: SMS for immediate re-engagement and email for follow-up. Upsella helps automate the SMS side, recovering more carts while you focus on running your business.
References
- [1] ClickPost. "Cart Abandonment Statistics 2025". 2025.
- [2] Baymard Institute. "50 Cart Abandonment Rate Statistics". 2025.
- [3] Email Vendor Selection. "Cart Abandonment Rate Statistics". 2025.
- [4] Cropink. "Cart Abandonment Statistics". 2025.
- [5] Tidio. "Shopping Cart Abandonment Statistics". 2025.
- [6] Postscript & CartBoss. "SMS Cart Recovery Benchmarks". 2025.
Ready to boost your revenue with SMS upsells?
Upsella automatically sends AI-powered SMS upsells after customer purchases. Start your free trial today and unlock hidden revenue effortlessly.